A filtered perspective on the Indian economy
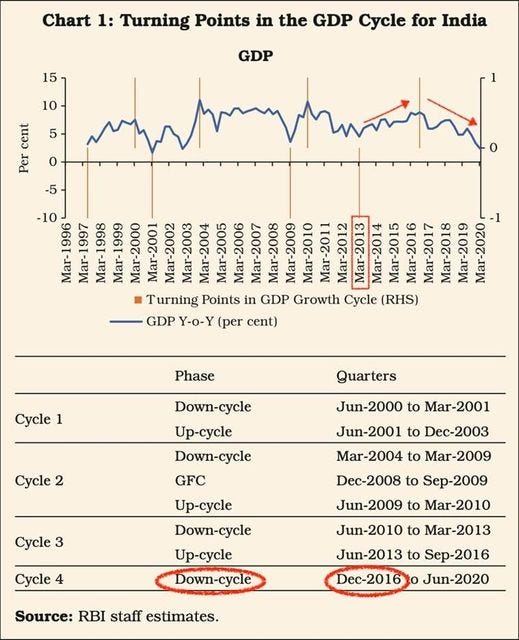
What is the state of the Indian economy today? This question can be answered in many ways. Recently, I came across a graphical take on it that suggested we started heading down after the momentous day of November 8, 2016 and have never looked back- unfortunately not a good thing in this case. Starting with demonetization some suggested that it was the hasty implementation of GST, and then the NBFC crisis before the COVID-19 pandemic completely tanked the economy. Would this picture be conformed by a preliminary business cycle style analysis?
Macroeconomists doing business cycle analysis typically engage in some kind of filtering exercise to separate the trend from the cyclical fluctuations of a macroeconomic time series. The most popular filter among many available is the Hodrick- Prescott filter. Once the GDP series is filtered, then we would compute percent deviations from the trend and typically graph them. These deviations from the trend are called as business cycles. The following graph gives the percent deviations from trend from seasonally adjusted chained quarterly GDP series in 2000 Rupees. You can access the series here on the fabulous FRED database maintained by the St. Louis Federal Reserve along with other series used in this post.
The deviations above the zero line are expansionary phases and those below are the recessionary phases. The above graph clearly shows the recessions that followed the 2001 dot.com bubble and 2007-08 financial crisis respectively. However, for the post demonetization phase it shows a minor decline and then an upward trajectory till the pandemic sunk the ship. This is a bit confusing as it seems to contradict the story shown by the growth rates above. Is this because the HP-Filter does not allow drastic changes in the slope of the trend? The degree of smoothing that is implied by the HP Filter has shown to be a factor making it unsuitable to extract trends from data with stochastic trend. See Perron & Shi 2019 for a modified HP Filter and related research.
While it might be a fruitful exercise to use some of the available modifications of the HP Filter and compare the results, Hamilton (2018) argued that the use of HP filter could lead to spurious dynamics that may not be present in the original data generating process. Additionally, he argues that
Filtered values at the end of the sample are very different from those in the middle and are also characterized by spurious dynamics. (c) A statistical formalization of the problem typically produces values for the smoothing parameter vastly at odds with common practice. (d) There is a better alternative. A regression of the variable at date t on the four most recent values as of date t − h achieves all the objectives sought by users of the HP filter with none of its drawbacks.
The obvious exercise then is to apply the Hamilton filer and compare it with the series from HP filter to see which fits the narrative of declining growth rates above. The following graph gives this comparison.
It can be clearly seen that the Hamilton cycle for India corroborates the growth rate story almost perfectly. There seems to be a deceleration from 2016 onwards with actual recession beginning around 2018 only to be worsened by the pandemic later. The following graph for index of production for consumer durables corroborates the story.
This also throws some light on which filter better captures the true state of the Indian economy but with the caveat that additional evidence should be brought in to bear on the issue. Also, there are other filters that should be tried and then results compared for robustness. Overall, for the general characteristics of business cycles for India and I hypothesize for the developing countries in general, the use of a particular filter does not seem to matter. Consumption and Investment continue to be procyclical with the latter being much more volatile than the former under both filtering methods.
PFCE= Private Final Consumption Expenditure
GFCE=Government Final Consumption Expenditure
GFCF=Gross Fixed Capital Formation
The following table gives the data on variation of different components of GDP relative to the variation in GDP. Use of either filters leads us to the same conclusions that have been well established in the literature.


